
See which containers are running
Find a container and inspect its reported state, CPU and memory usage using observations collected from monit-docker.

Atraxis brings observations from your monitoring tools into one web interface. Inspect the state of your services, find their latest measurements and prepare automation rules with Atropos. This free software runs on your own infrastructure.
For system administrators and teams operating infrastructure.
No account needed: real Covenant metrics, alerts delivered to a local receiver and synthetic scenarios.
01Inspect, prepare rules and act

Containers, CPU, memory

Certificates and expiry
 Atraxis
Reads the configured source APIs and lets you prepare rules.
 Atropos
Stores and evaluates rules, and orchestrates workflows.
 Auton
Runs authorized tasks on your servers.
Atraxis queries monit-docker and CertLord directly, without Prometheus or Covenant. Collection is read-only; activating rules and executing jobs remain separate operations.
02Optional: collect metrics and send notifications
 Covenant
Transforms data and exposes metrics for Prometheus.
 Prometheus®
Scrapes Covenant, stores metrics and evaluates alerting rules.
Independent third-party projectGroups alerts and delivers notifications.
Independent third-party projectCovenant reads its sources. Prometheus collects the exposed metrics, then sends any firing alerts to Alertmanager.
Atraxis brings together monit-docker and CertLord observations and selected numeric Prometheus metrics, including those produced by Covenant. Metric reading is experimental; time-series charts and metric-driven interventions are not supported yet. Atropos connections to Auton and Alertmanager require explicit configuration. Licenses and trademarks →
Select a component to understand its role, browse direct or Prometheus paths, and follow rules through to execution.
Inspect your resources in one inventory. Connect monit-docker for containers, CertLord for TLS certificates, and Prometheus for numeric metrics from Covenant or other collectors.
Find a container and inspect its reported state, CPU and memory usage using observations collected from monit-docker.
Look up domains, expiry dates and renewal information reported by CertLord.
When a tool stops responding, Atraxis retains its last observations and marks them as historical. The current state remains explicitly unknown.
For example: a worker reports 95% CPU. Find it in the inventory, check where the measurement came from and whether it is current, then prepare a test scenario for a threshold rule.

Create, edit and test rules from Atraxis. Atropos is the separate service that stores them, evaluates them and checks permissions.
Start from a template or edit an existing rule in the web editor. Inspect its versions and the revision that is currently active.
Submit scenarios, such as 95% CPU against an 80% threshold, then inspect the report produced for the exact tested version.
Review the rule and its report before confirming activation. Saving or testing a draft does not activate it or trigger an intervention.
These features require a configured Atropos service and appropriate permissions. Workflows and action execution need additional configuration and authorization.
Or another API application
atropos-clientAtroposInternal componentsRules, tests and permissions.
Explicit workflow admission.
Execute authorized steps and record their results.
Local commands for trusted operators.
Rules, runs and audit history.
SQLite by defaultThe engine and terminal share data when configured with the same storage and namespace.
AutonExecutes configured jobs.
Optional adapterRoutes notifications.
Optional adapterSaving, testing or activating a rule does not start a workflow. Technical diagram ↗
Install the engine on your infrastructure or just the client in your application. Python 3.11/3.12; the engine requires the system libmagic library.
python -m pip install 'atraxis-atropos[service]==1.0.4'python -m pip install 'atropos-client==1.0.4'The engine command is atropos. Atraxis 1.0.9 uses the published atropos-client 1.0.0; the engine remains an independent service.
Install the published versions on Linux amd64. The complete Compose stack includes TLS proxies and optional worker profiles.
docker pull decryptus/atraxis:1.0.9docker pull decryptus/atropos:1.0.4Complete Docker Compose installation ↗
Prepare your configuration and retain the data volumes. Downloading an image does not configure sources or activate rules.
The 1.0.9 guided installer and the Compose starter in tag v1.0.9 both deploy the verified Atraxis 1.0.7 image.
Install the platform from PyPI in a Python 3.11, 3.12 or 3.13 virtual environment with the system libmagic library.
python -m pip install atraxis==1.0.9
Behind a TLS proxy, keep the application port private, configure the actual proxy’s IPv4 network in general.trusted_proxy_networks and apply nginx per-client rate limiting together with the 1.0.7 upgrade.
The trusted proxy must overwrite X-Forwarded-For with $remote_addr. Failed Basic logins are isolated by client address and account. Missing or ambiguous forwarding headers are rejected. Clients sharing a NAT address still share address budgets; retain ingress rate limits.
Atraxis package on PyPI ↗
Installation and configuration ↗
Docker Compose guide ↗
Configure the tools to query and their access credentials. Atraxis collects observations in read-only mode. Browse them on the web, through the command line or in the terminal interface.
Stable for the documented reference profile. The public demo remains experimental and read-only. This is self-hosted software, not a hosted production service or a high-availability guarantee.
Start with the Atraxis guide to install the software and connect your sources. The Atropos guide covers the rule engine configuration. Technical documentation is currently in English.
Installation, monitoring sources, and web and terminal interfaces.
Rules, workflows and an independent API client.
monit-docker observes containers, CertLord manages certificates, and Atraxis brings their observations together. Atropos provides the rule engine. Covenant transforms data into metrics. Prometheus stores them and Atraxis can display their selected latest values. Alertmanager receives Prometheus alerts; Auton can run tasks authorized by Atropos.
This describes the architectural direction. It does not imply that every integration is available today. Prometheus and Alertmanager are independent third-party projects; their inclusion does not imply endorsement. Licenses and trademarks →
AtraxisWeb and terminal interfaces to inspect inventory and manage rules through Atropos.
AtroposRules, workflow orchestration and execution history in a separate engine.
CovenantMetric collection, transformation and exposition.
Prometheus®Third-party project ↗Metric storage and alert rule evaluation.
Notification routing, grouping and delivery.
AutonExecution of explicitly authorized jobs.
monit-dockerDocker container monitoring and local automated actions.
TLS certificate issuance, renewal and deployment.
Textual interfaces for Auton operations and monit-docker observations. These screenshots use synthetic demonstration data.
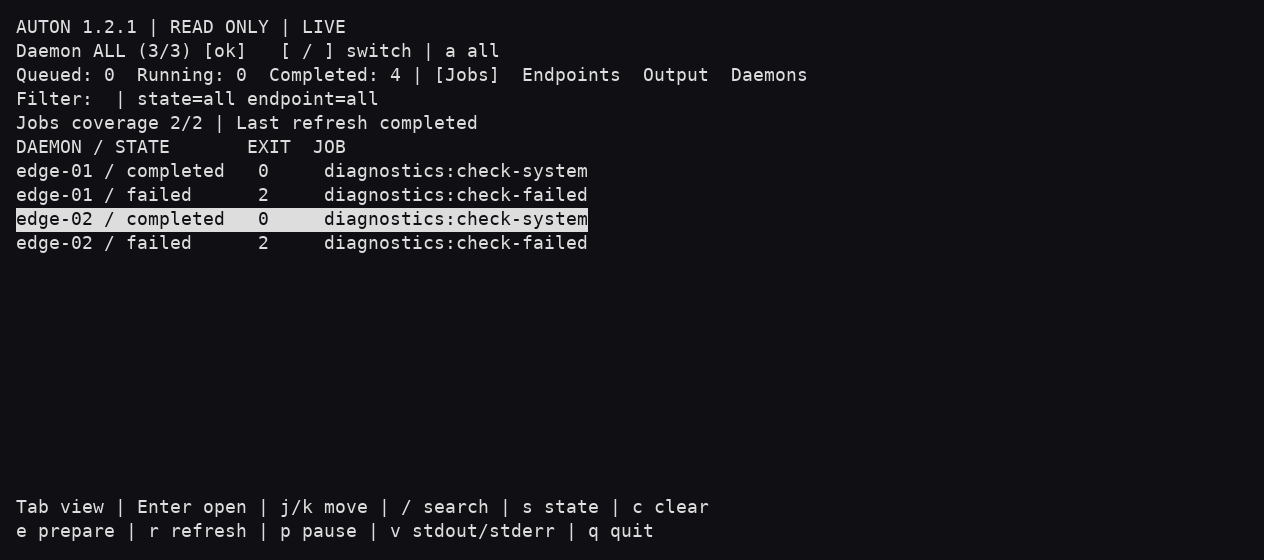
Open the terminal guide ↗
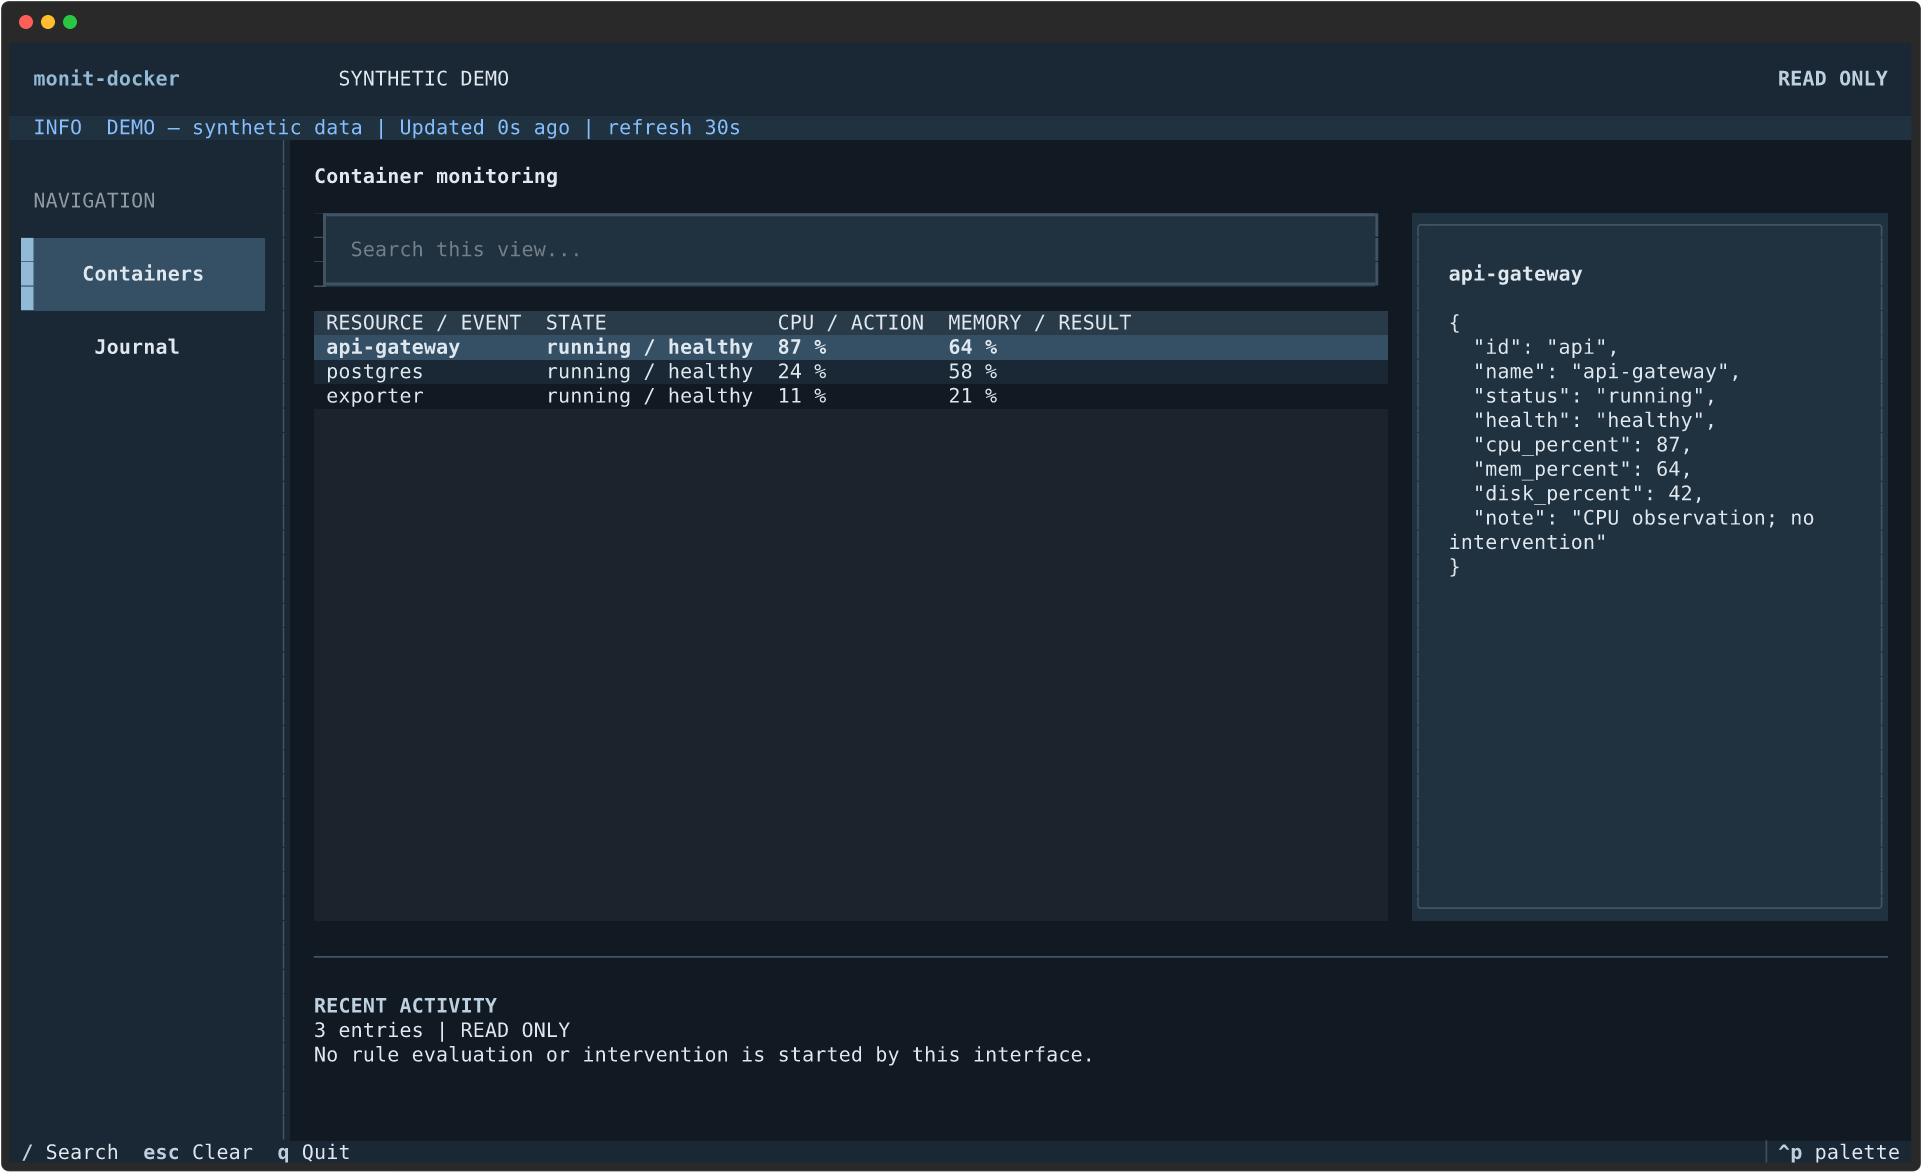
Open the terminal guide ↗
A three-minute tour of Docker monitoring: resource checks, cron and serve modes, and web and terminal interfaces.
Follow real Covenant metrics, then explore the public demo’s synthetic scenarios. To connect your own containers, certificates and metrics, follow the installation guide.